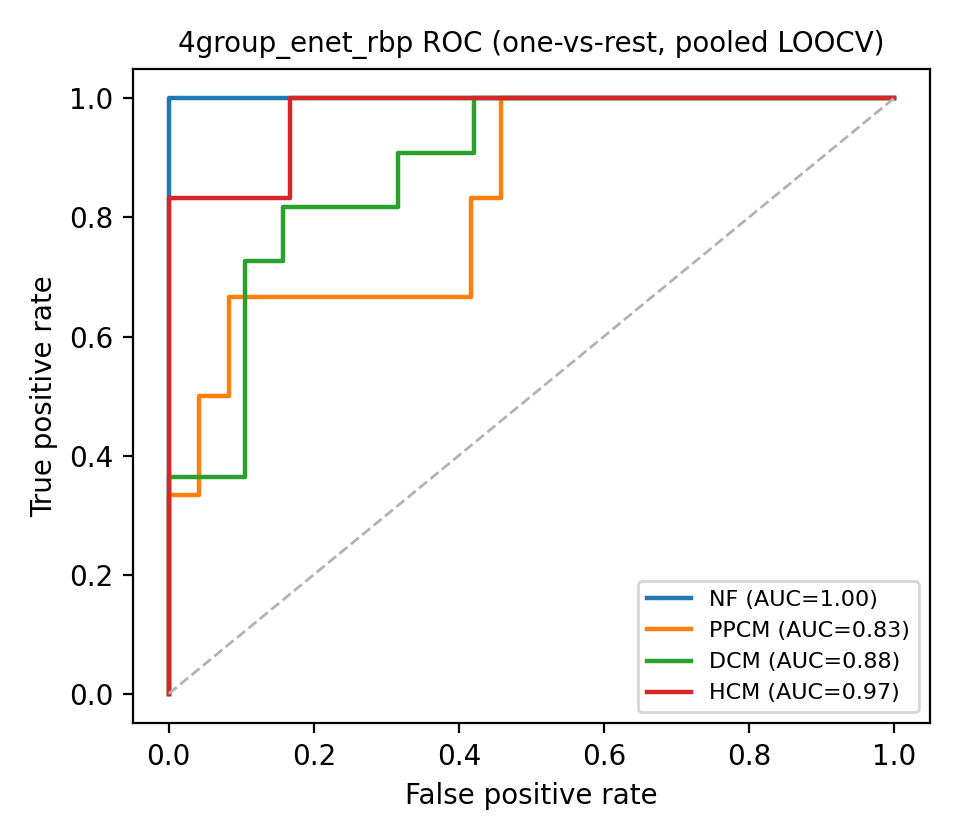
RandomForest, XGBoost and elastic-net multinomial logistic regression predicting disease group
from VST expression, compared across two feature sets (full pairwise-DEG-voting gene set vs
RBP-only gene set) and two group configs (all 4 groups, and NF excluded).
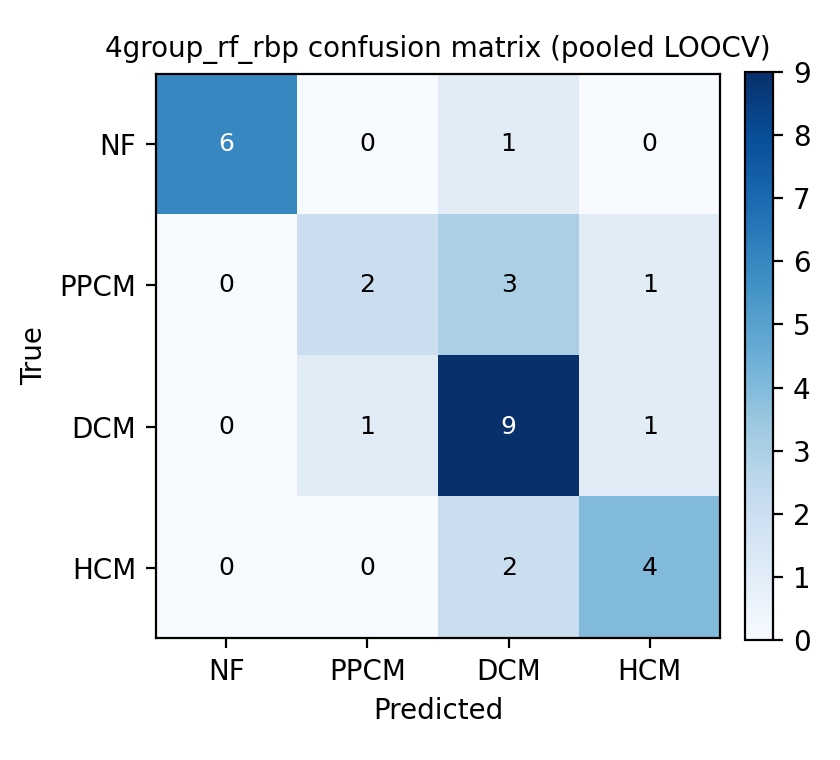
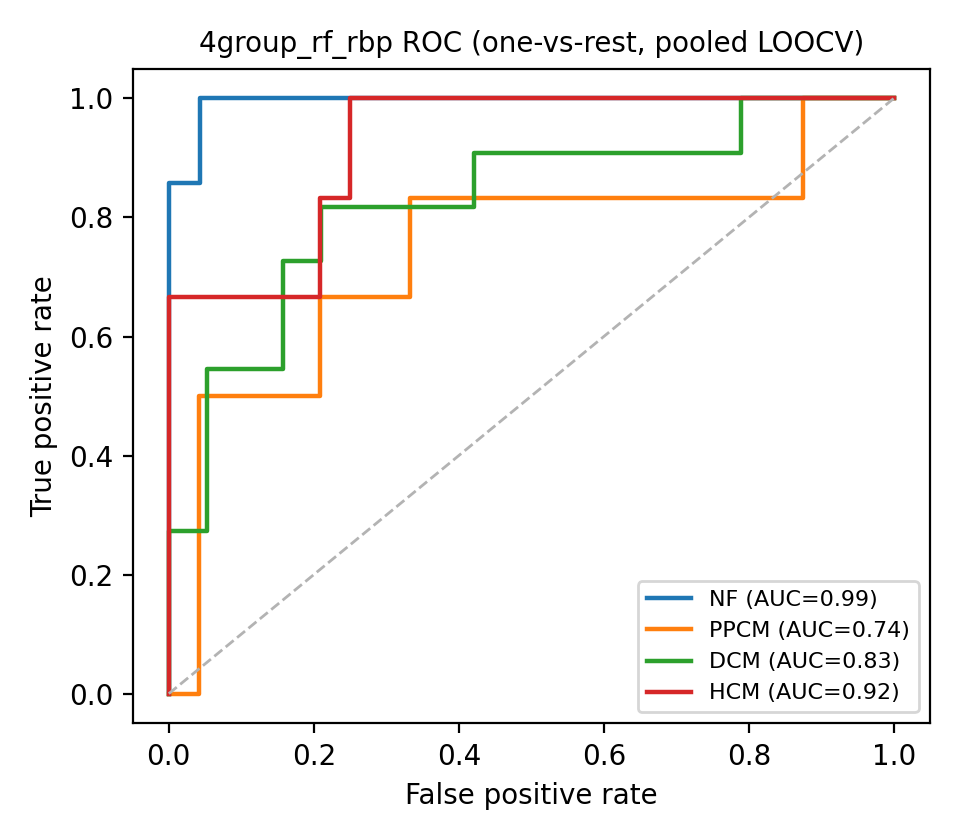
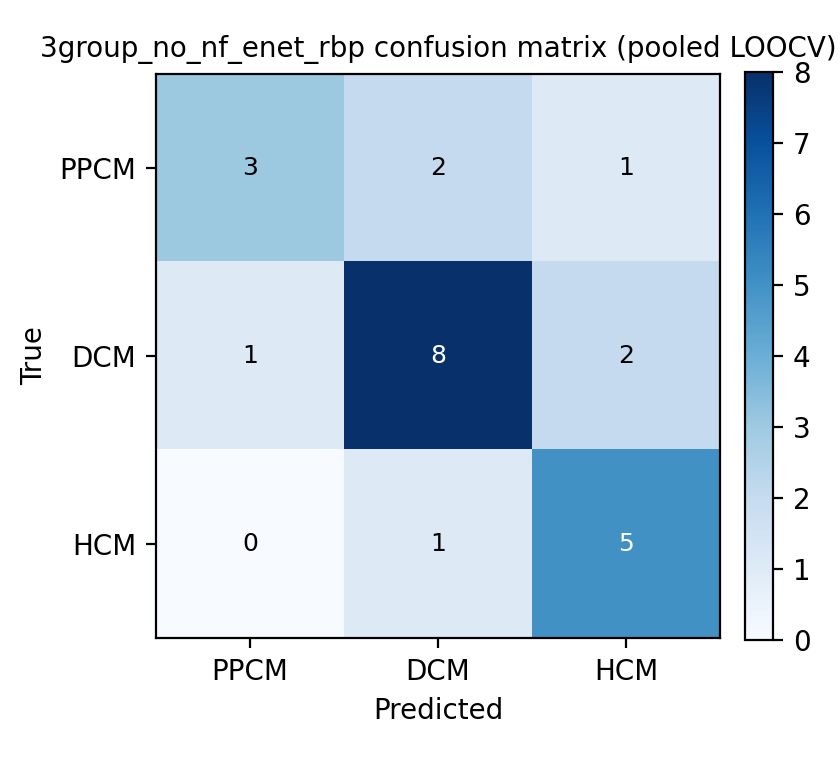
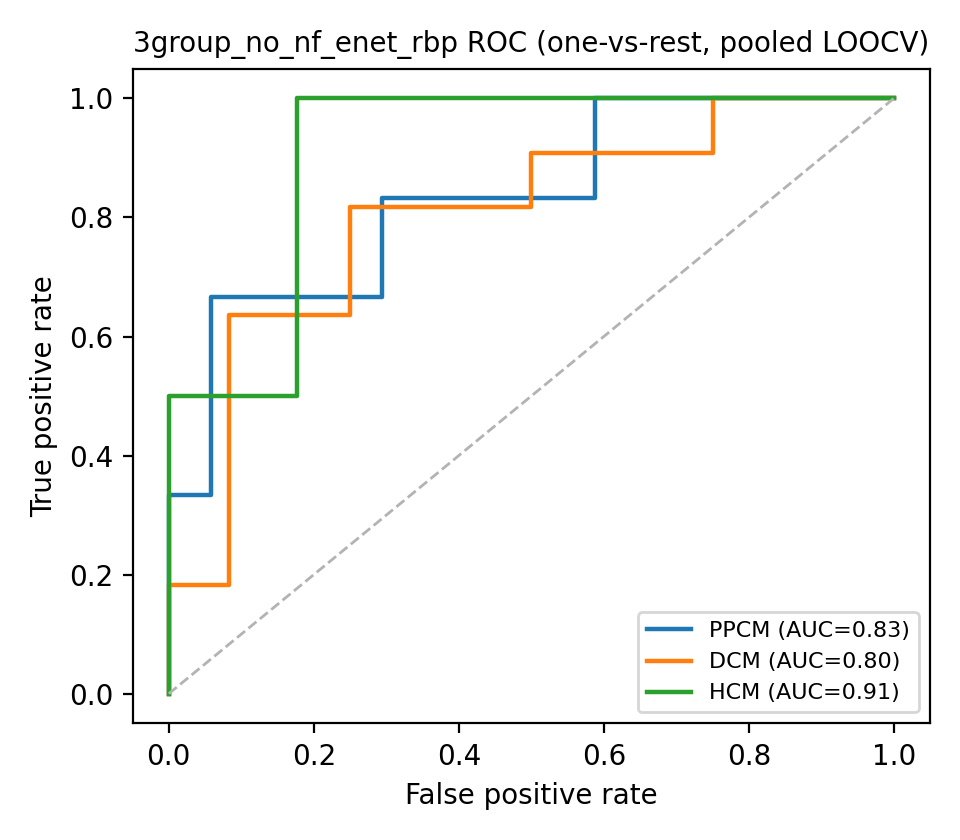
Evaluated with pooled Leave-One-Out CV: every sample is held out exactly once (refit on the
rest), and metrics (accuracy, F1, confusion matrix, ROC/AUC, specificity) are computed once
over all pooled held-out predictions — a real generalization estimate, not an in-sample fit.
Folds are refit in parallel across all CPU cores. Hyperparameters: RandomForest max_depth=3,
n_estimators=100; XGBoost max_depth=3, n_estimators=10; elastic-net logistic regression
(l1_ratio=0.5, C=1.0, features standardized) (see CONFIG in run_treemodel.py).
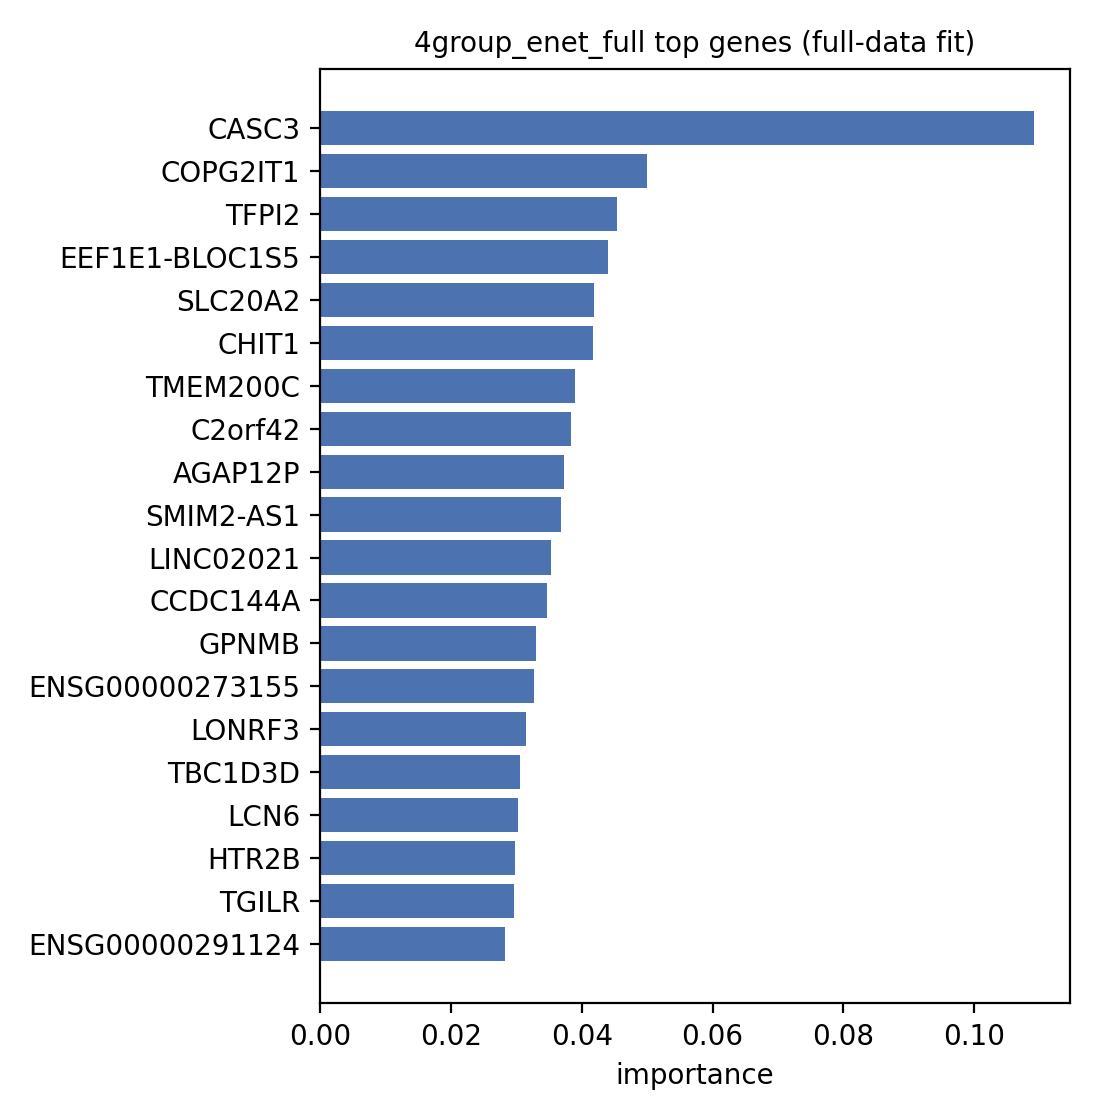
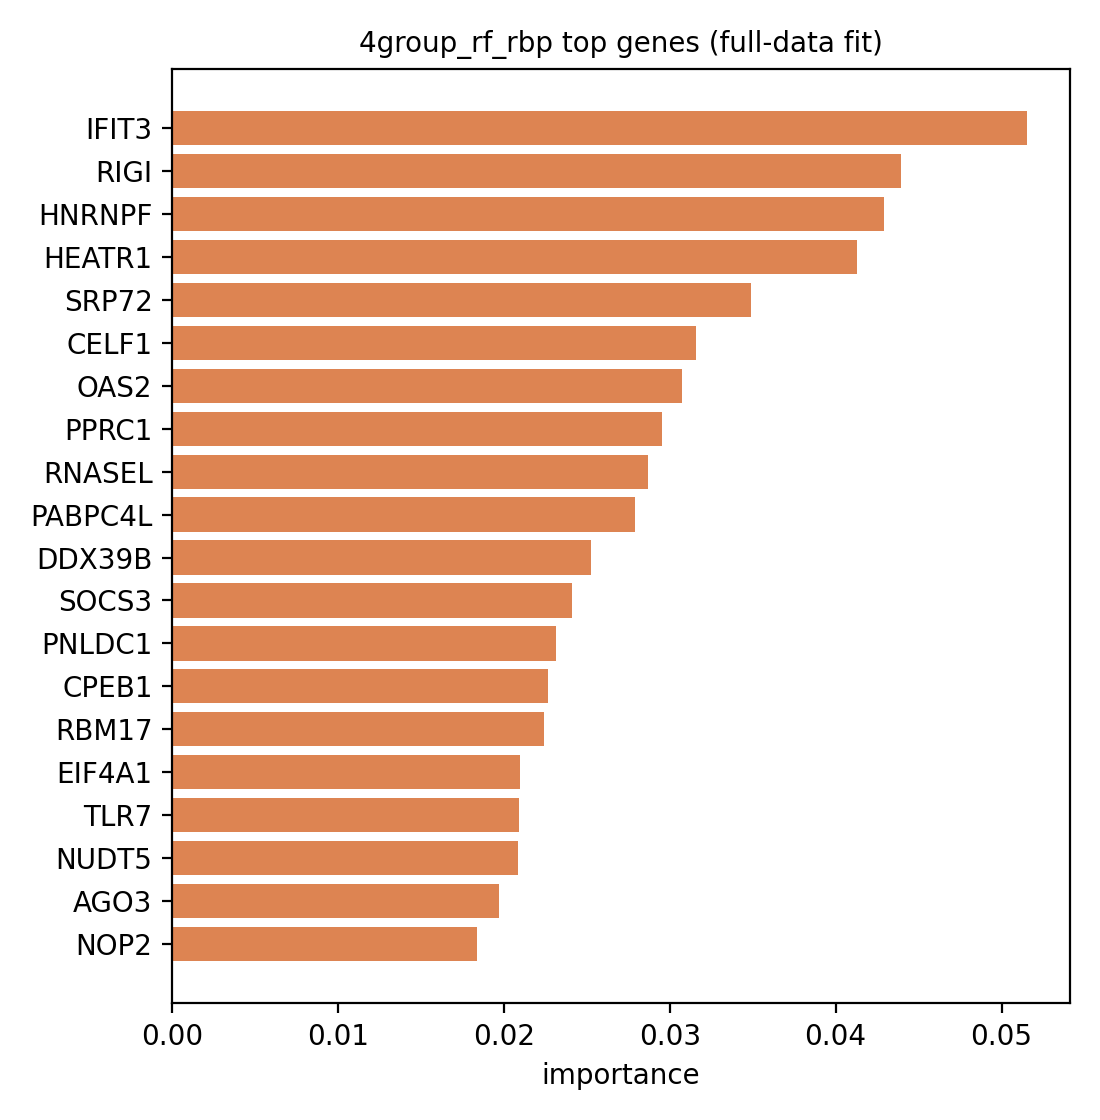
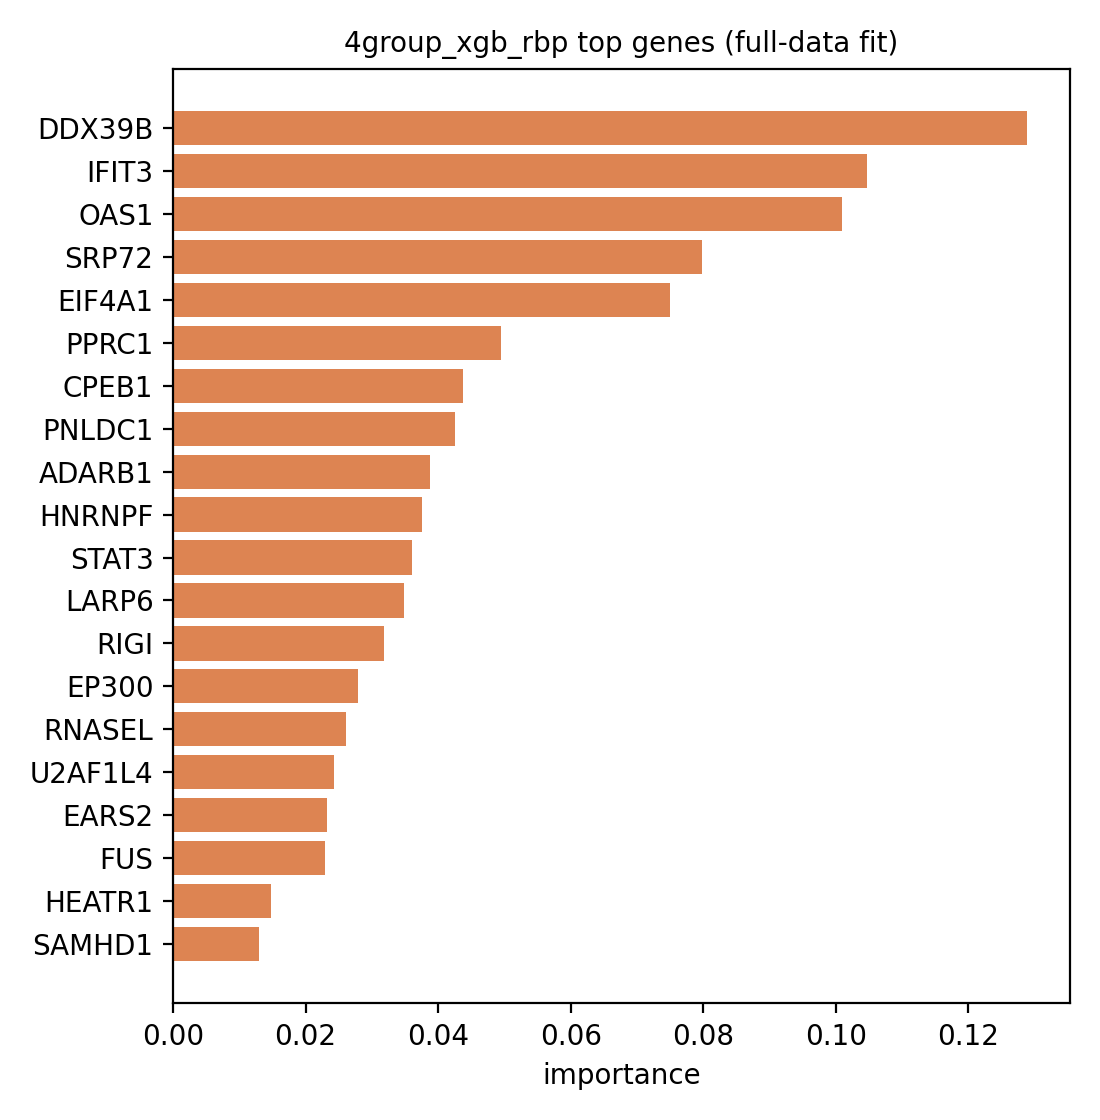
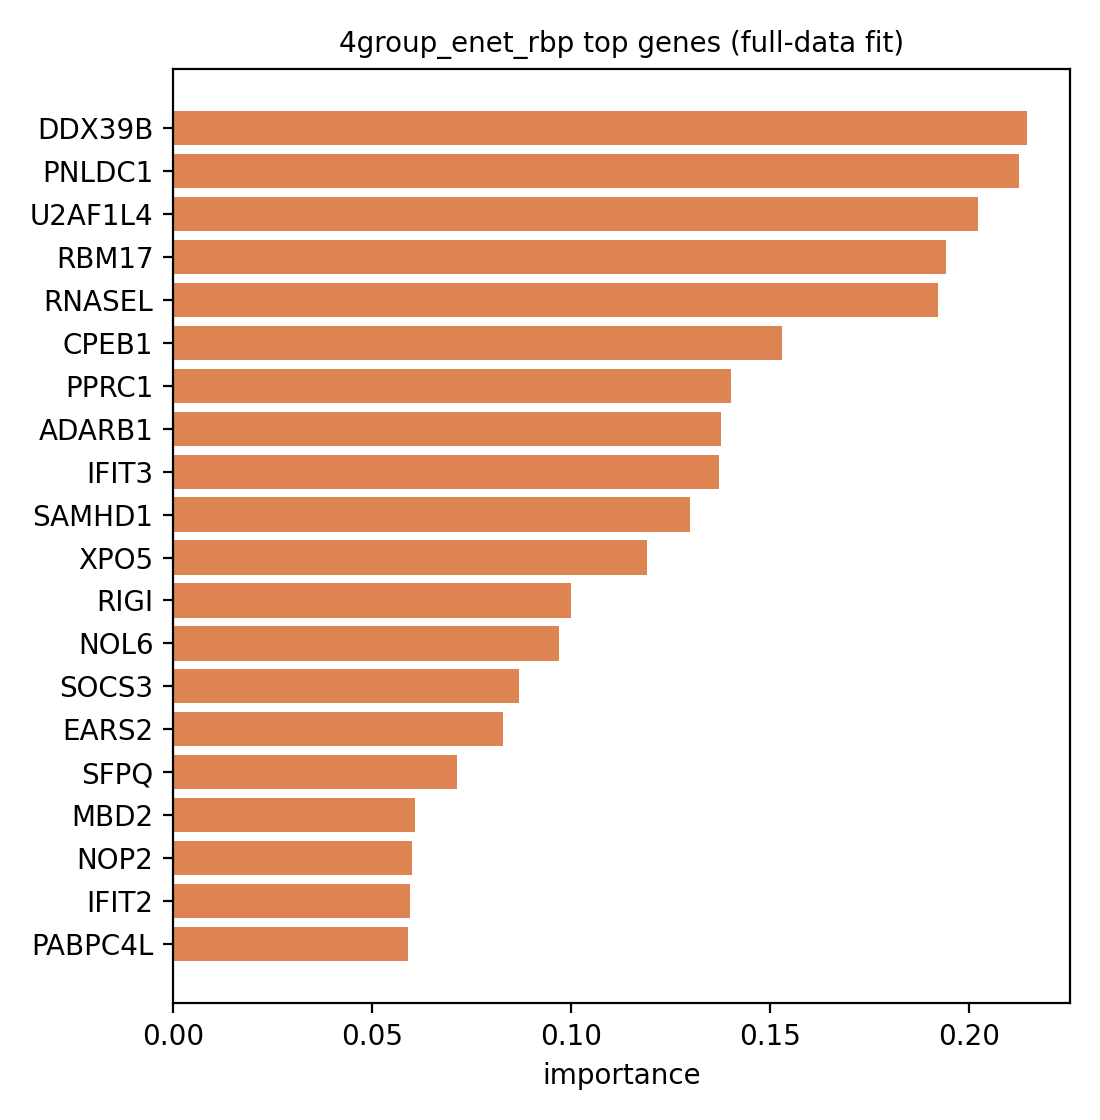
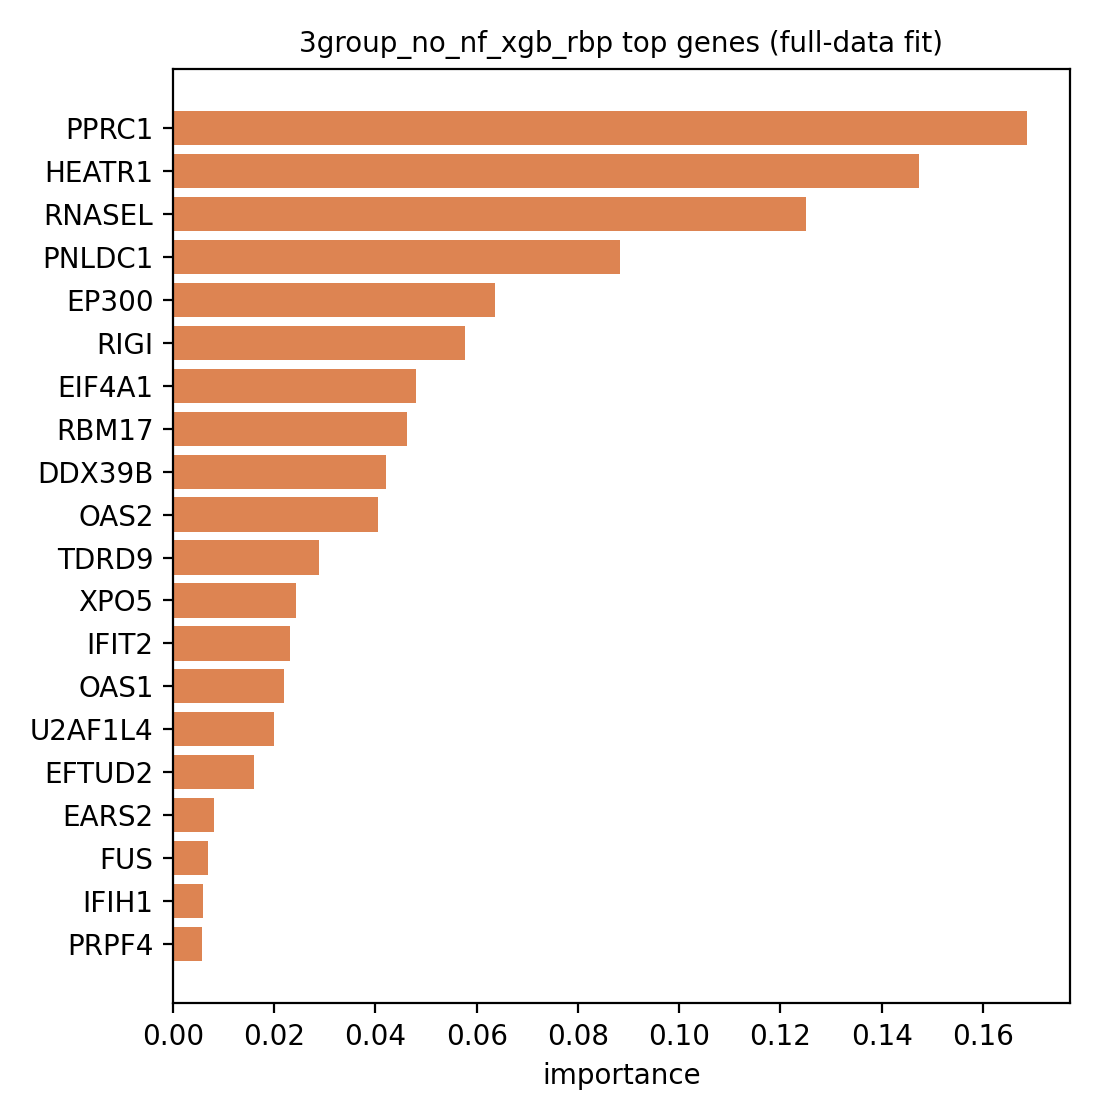
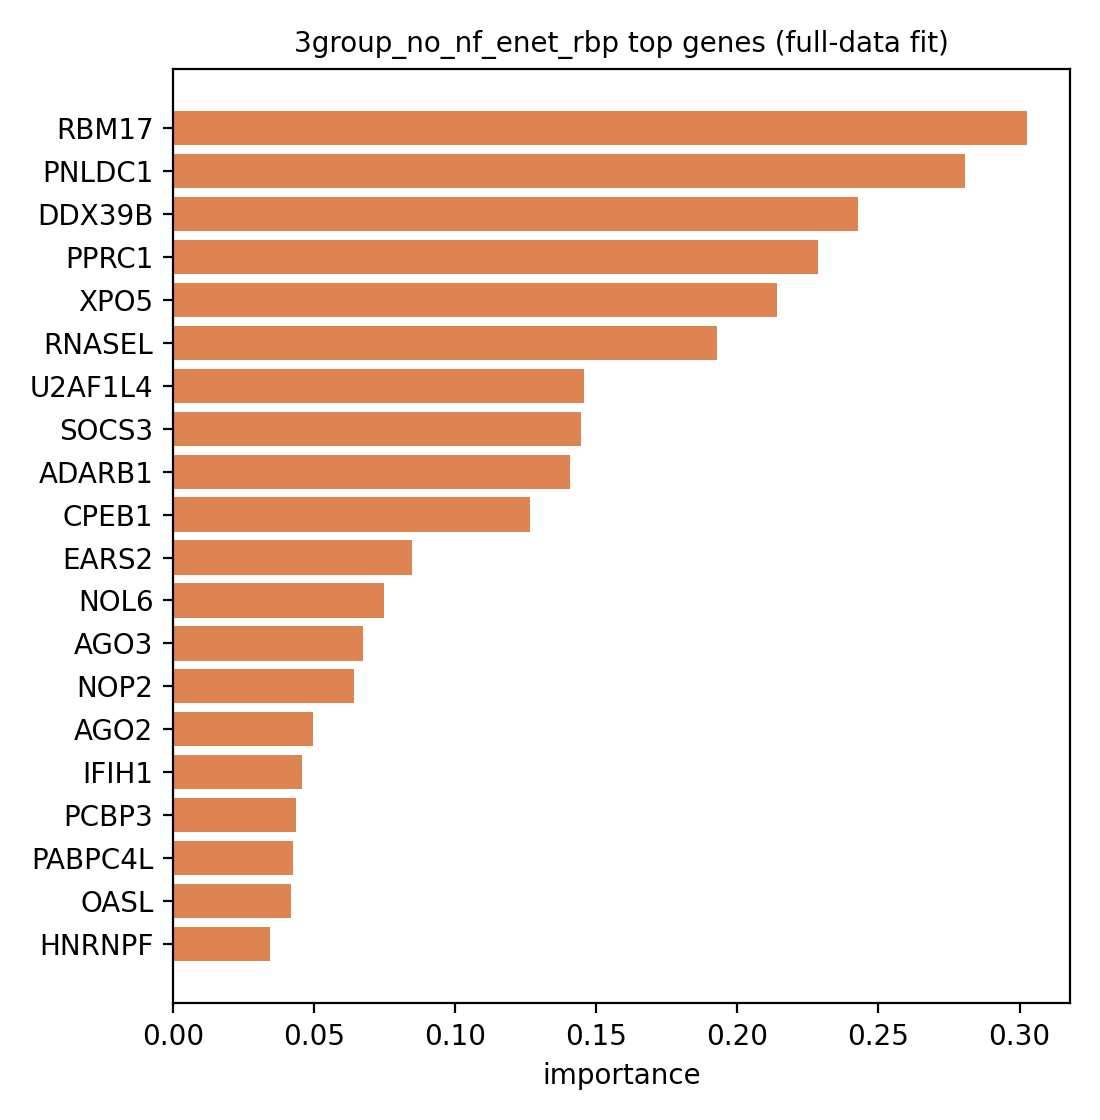
Feature importance (tree feature_importances_, or mean |coefficient| across
classes for elastic-net) still comes from a separate fit on the full sample set for that
group config, since that question is about the final model's structure, not generalization.
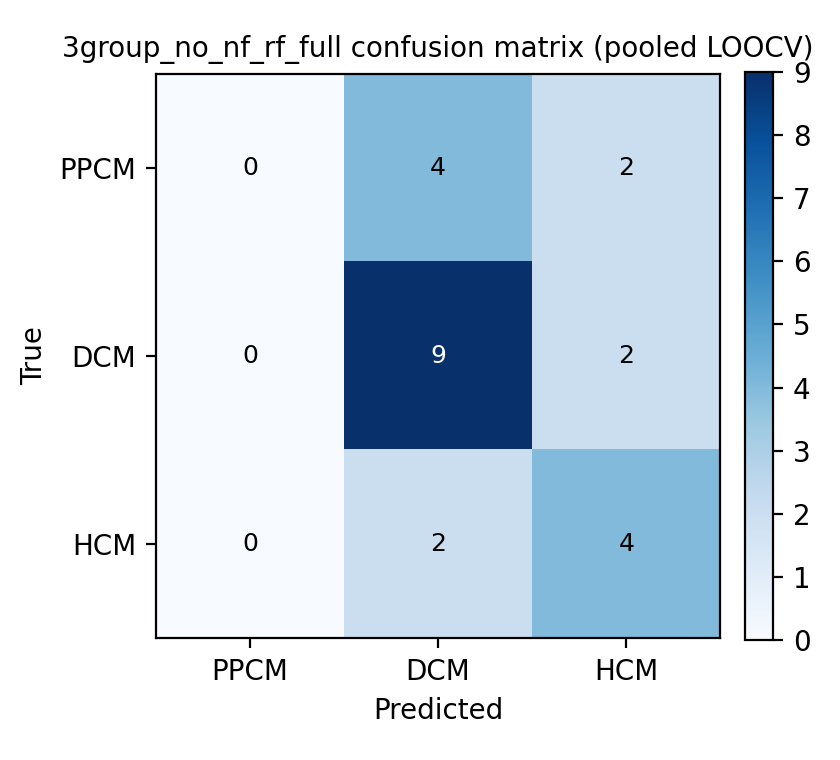
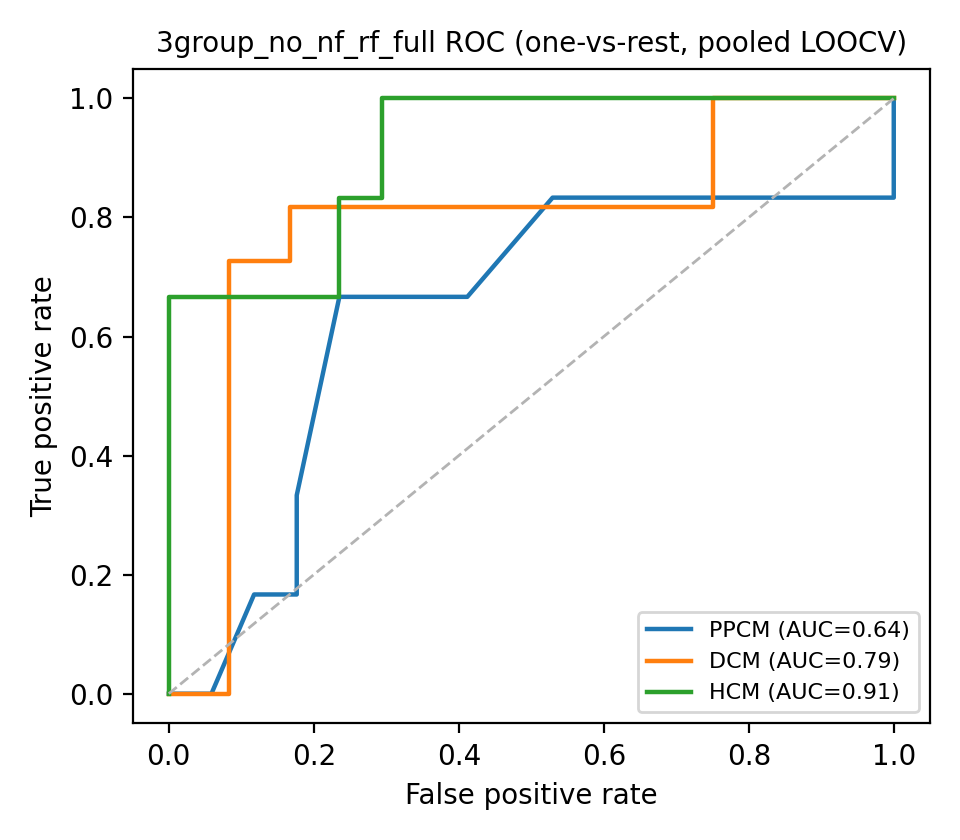
The 3-group run drops NF (it separates from disease groups trivially) to see how well the
harder within-disease groups (PPCM/DCM/HCM) separate.
4-group: NF / PPCM / DCM / HCM
Model comparison summary
Pooled Leave-One-Out CV. One row per model x feature-set combination.
model
feature_set
n_features
n_samples
accuracy
f1_macro
macro_auc
mean_specificity
RandomForest
Full-gene set (union of pairwise-DEG voting)
2844
30
0.600
0.527
0.858
0.856
XGBoost
Full-gene set (union of pairwise-DEG voting)
2844
30
0.567
0.544
0.645
0.845
Elastic-net logistic regression
Full-gene set (union of pairwise-DEG voting)
2844
30
0.800
0.783
0.944
0.932
RandomForest
RBP-only set
72
30
0.700
0.682
0.872
0.890
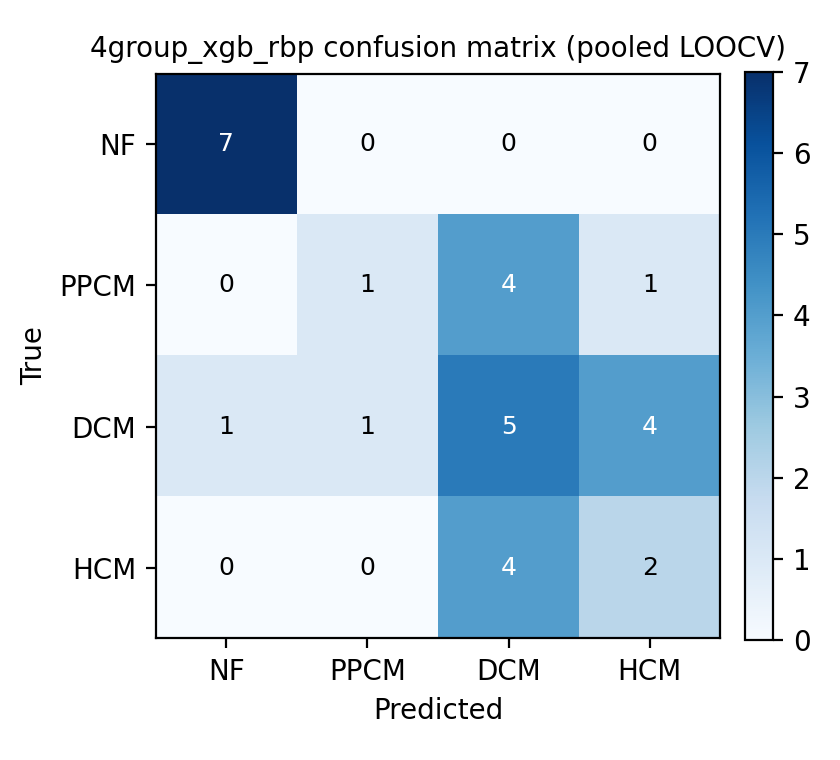
XGBoost
RBP-only set
72
30
0.500
0.477
0.768
0.821
Elastic-net logistic regression
RBP-only set
72
30
0.800
0.790
0.921
0.929
Where do RBP genes rank in the full-gene model?
Percentile = 100 means most important gene of 2844 in the full-gene set; top 10 RBP genes by importance shown.
RandomForest — RBP genes within full-gene importance ranking (n=41, median percentile=51.5)
gene_symbol
importance
rank
percentile
IFIH1
0.004
44
98.453
IFIT3
0.004
66
97.679
FUS
0.004
67
97.644
EARS2
0.004
84
97.046
DDX39B
0.003
120
95.781
HNRNPF
0.003
147
94.831
STAT3
0.003
151
94.691
RBM17
0.003
166
94.163
U2AF1L4
0.002
253
91.104
SHFL
0.001
285
89.979
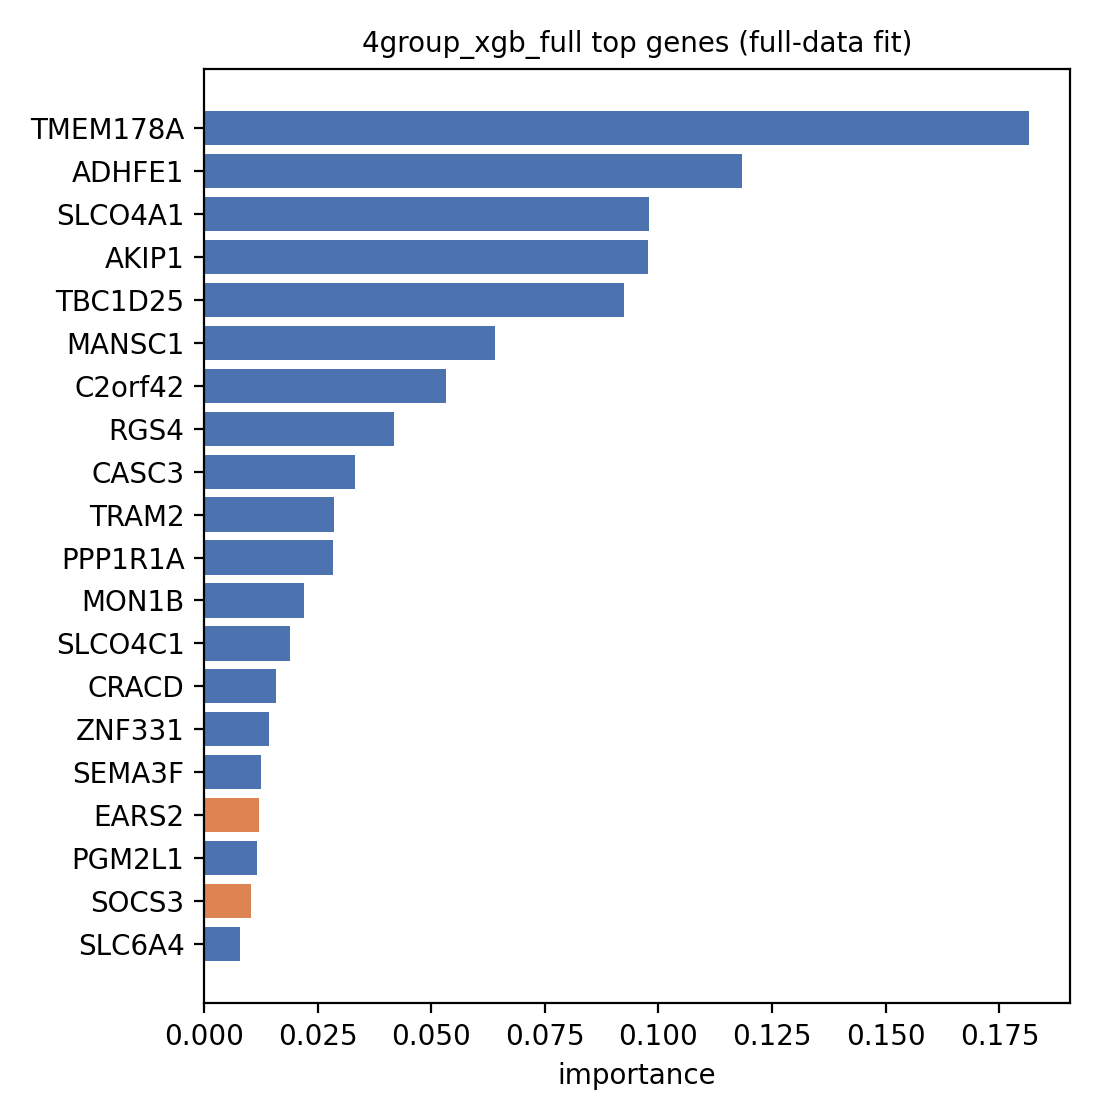
XGBoost — RBP genes within full-gene importance ranking (n=41, median percentile=44.7)
gene_symbol
importance
rank
percentile
EARS2
0.012
17
99.402
SOCS3
0.010
19
99.332
RNASEL
0.003
27
99.051
PPRC1
0.000
120
95.781
HNRNPF
0.000
204
92.827
STAT3
0.000
228
91.983
SHFL
0.000
396
86.076
SNRPB
0.000
548
80.731
DHX38
0.000
626
77.989
NUDT7
0.000
639
77.532
Elastic-net logistic regression — RBP genes within full-gene importance ranking (n=41, median percentile=41.6)
gene_symbol
importance
rank
percentile
DDX39B
0.025
30
98.945
PPRC1
0.013
81
97.152
IFIT3
0.008
117
95.886
XPO5
0.002
203
92.862
OAS2
0.001
219
92.300
HNRNPF
0.000
341
88.010
STAT3
0.000
362
87.271
OASL
0.000
503
82.314
RNASEL
0.000
566
80.098
SHFL
0.000
651
77.110
Per-model detail
Confusion matrix, ROC curves and top feature importance for each model x feature-set combination.
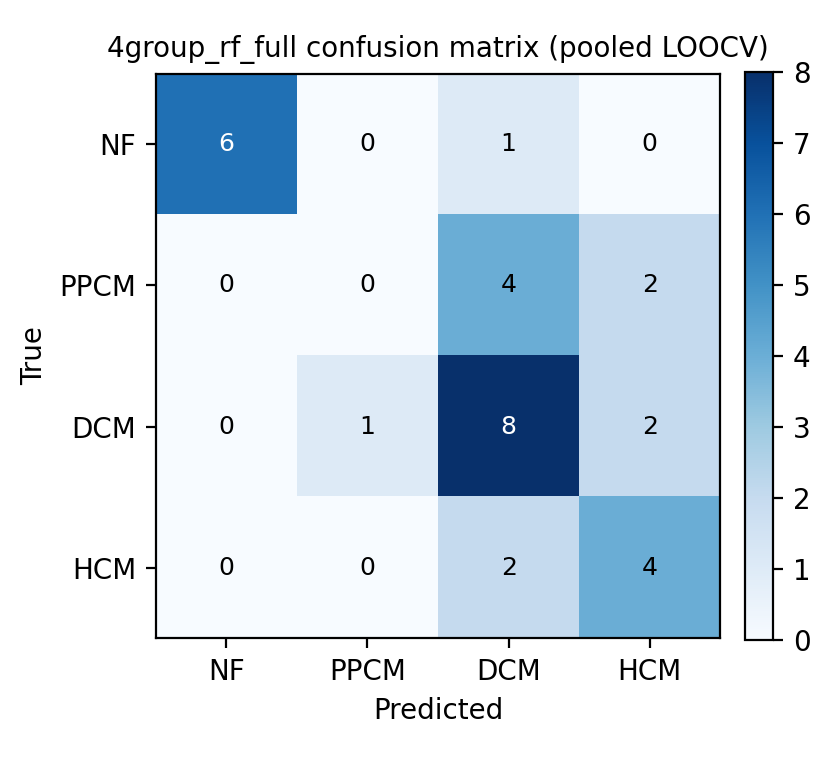
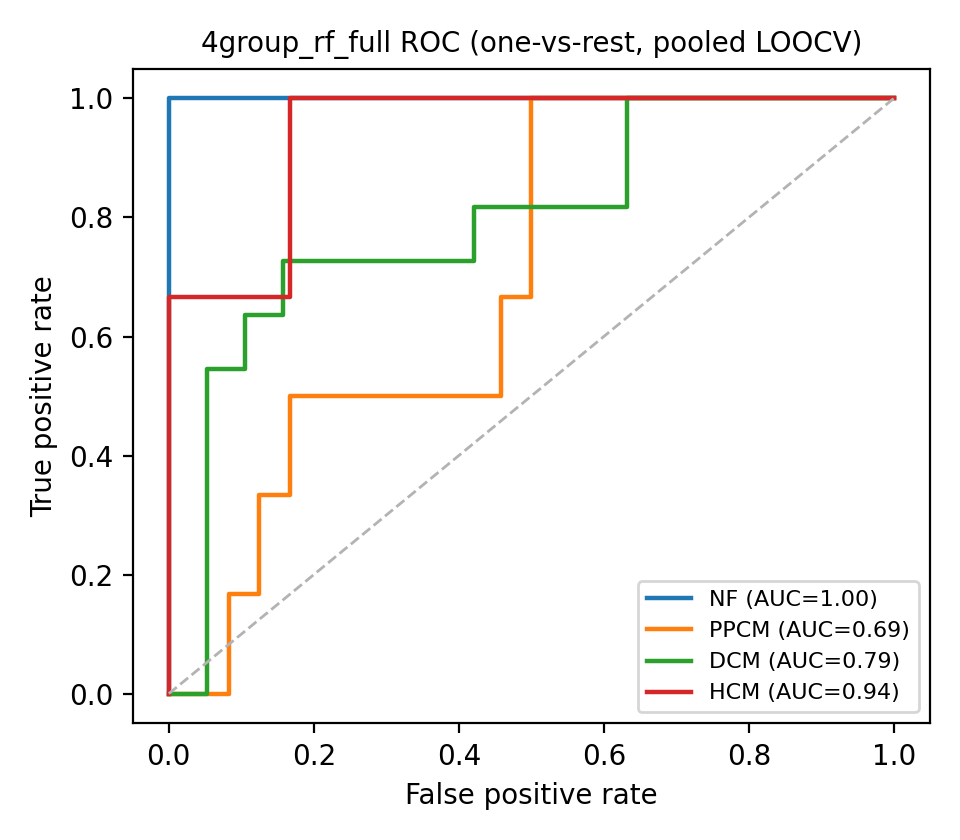
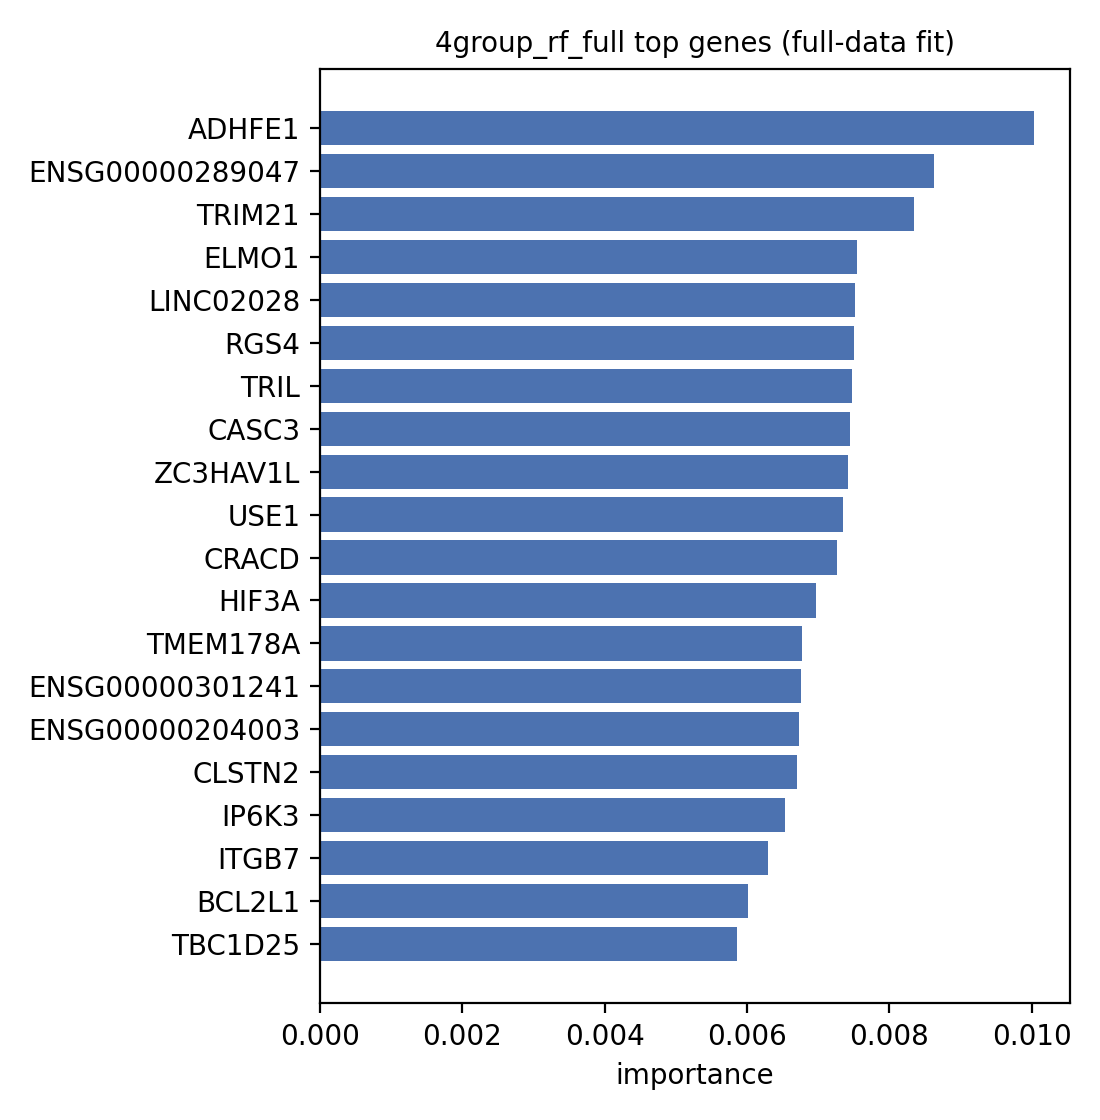
RandomForest — Full-gene set (union of pairwise-DEG voting)
Confusion matrix (pooled LOOCV)
ROC (one-vs-rest, pooled LOOCV)
Top feature importance (full-data fit)
class
precision
recall_sensitivity
specificity
f1
support
auc
NF
1.000
0.857
1.000
0.923
7
1.000
PPCM
0.000
0.000
0.958
0.000
6
0.694
DCM
0.533
0.727
0.632
0.615
11
0.794
HCM
0.500
0.667
0.833
0.571
6
0.944
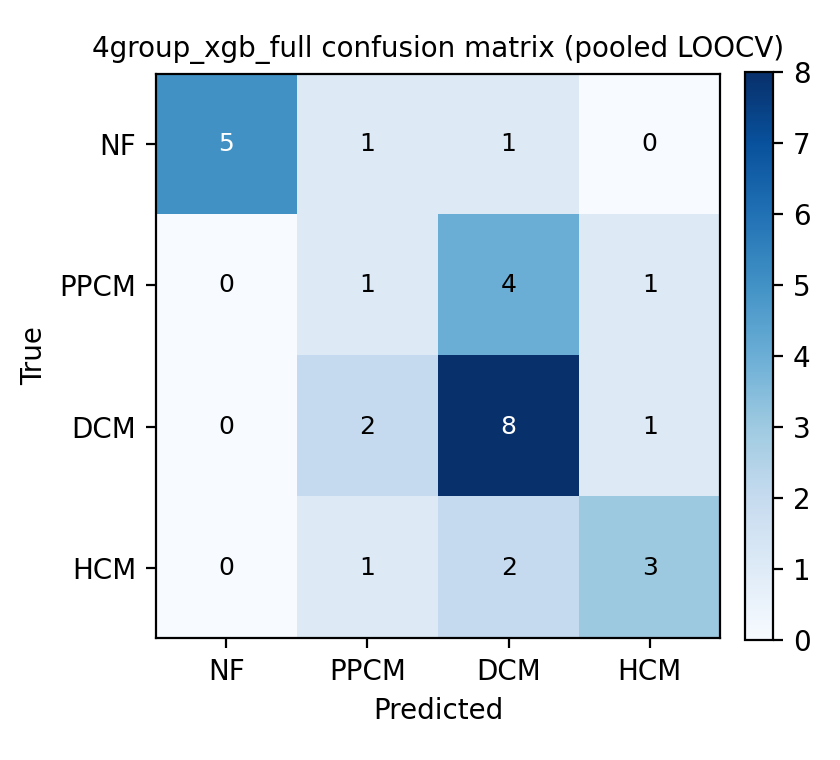
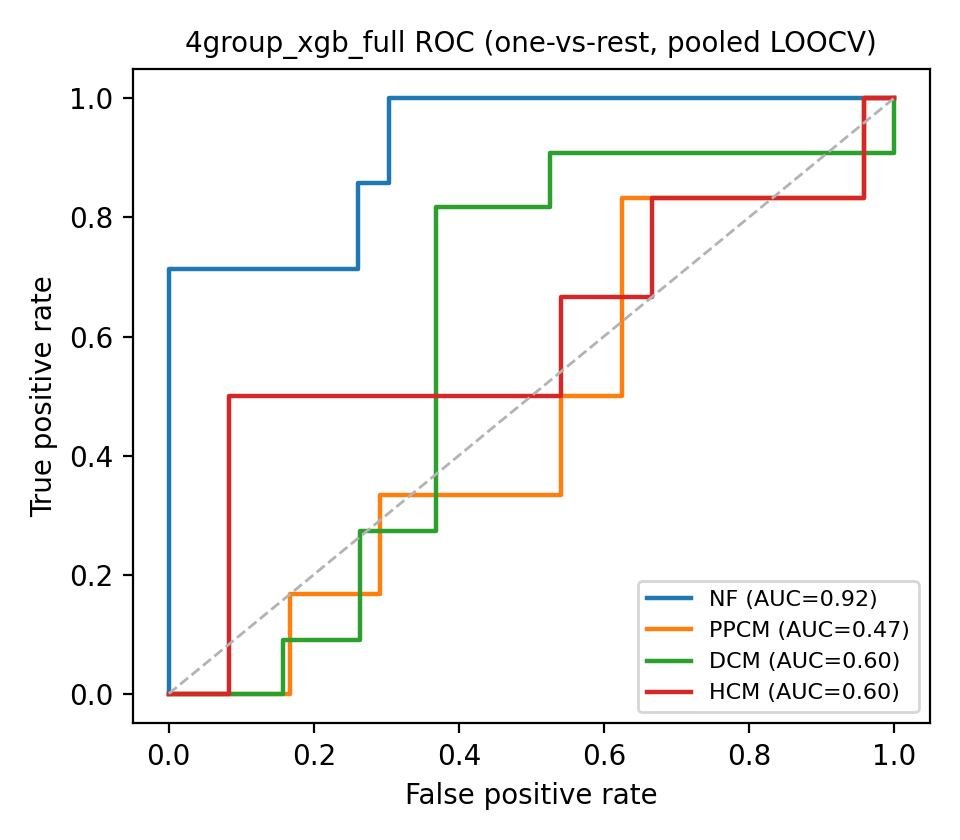
XGBoost — Full-gene set (union of pairwise-DEG voting)
Confusion matrix (pooled LOOCV)
ROC (one-vs-rest, pooled LOOCV)
Top feature importance (full-data fit)
class
precision
recall_sensitivity
specificity
f1
support
auc
NF
1.000
0.714
1.000
0.833
7
0.919
PPCM
0.200
0.167
0.833
0.182
6
0.465
DCM
0.533
0.727
0.632
0.615
11
0.598
HCM
0.600
0.500
0.917
0.545
6
0.597
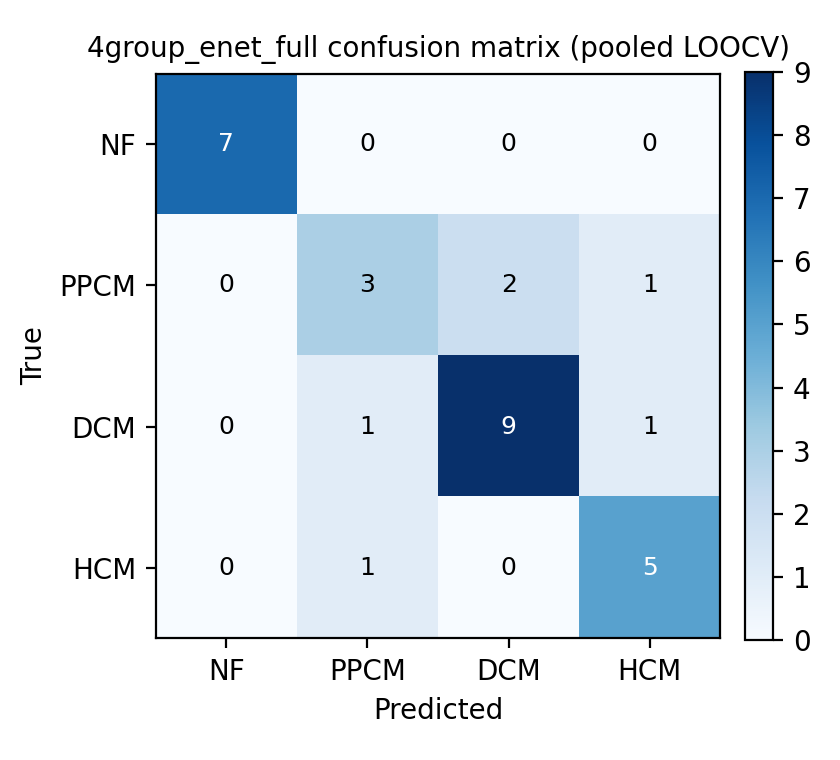
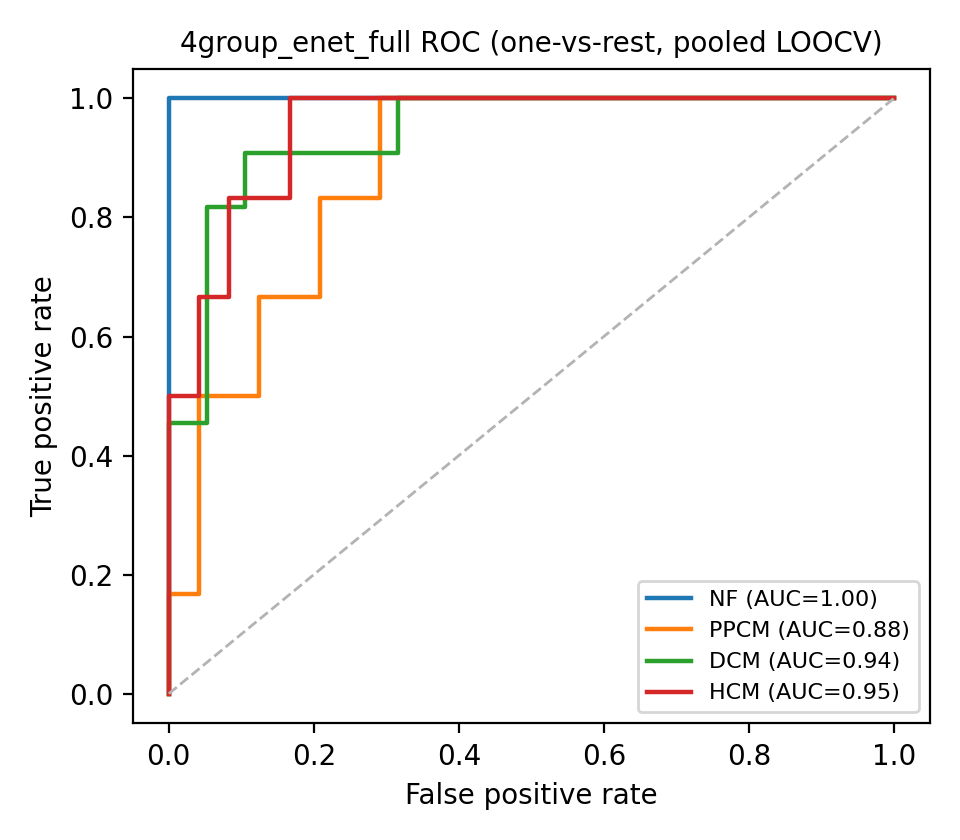
Elastic-net logistic regression — Full-gene set (union of pairwise-DEG voting)
Confusion matrix (pooled LOOCV)
ROC (one-vs-rest, pooled LOOCV)
Top feature importance (full-data fit)
class
precision
recall_sensitivity
specificity
f1
support
auc
NF
1.000
1.000
1.000
1.000
7
1.000
PPCM
0.600
0.500
0.917
0.545
6
0.882
DCM
0.818
0.818
0.895
0.818
11
0.943
HCM
0.714
0.833
0.917
0.769
6
0.951
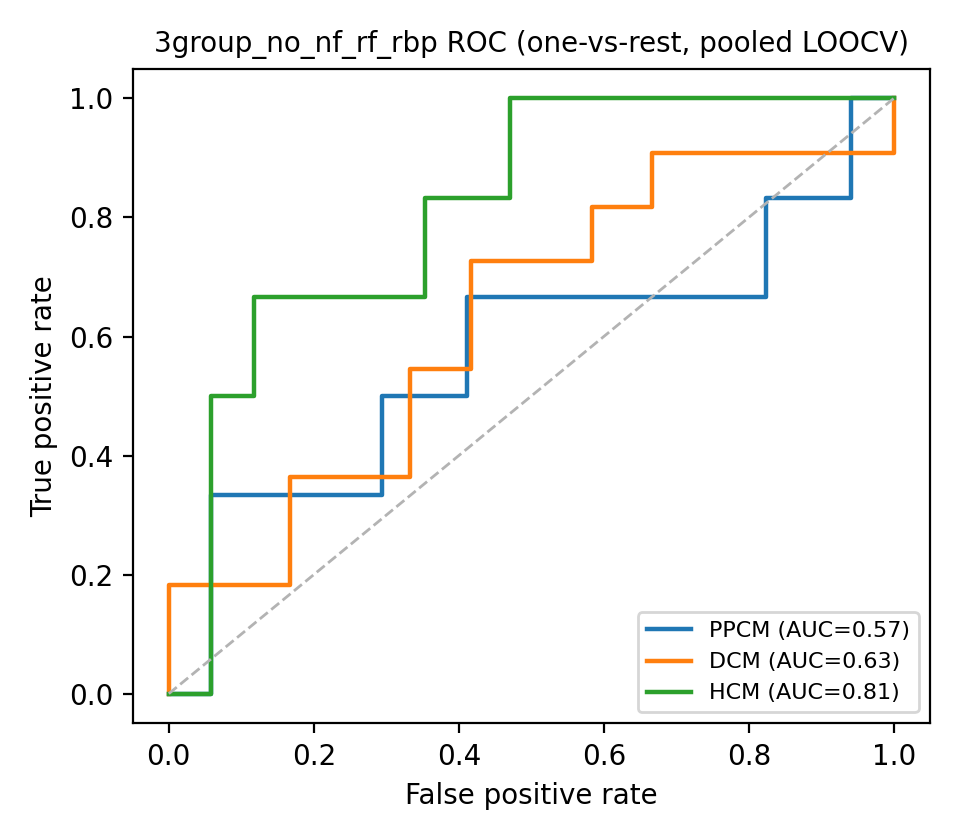
RandomForest — RBP-only set
Confusion matrix (pooled LOOCV)
ROC (one-vs-rest, pooled LOOCV)
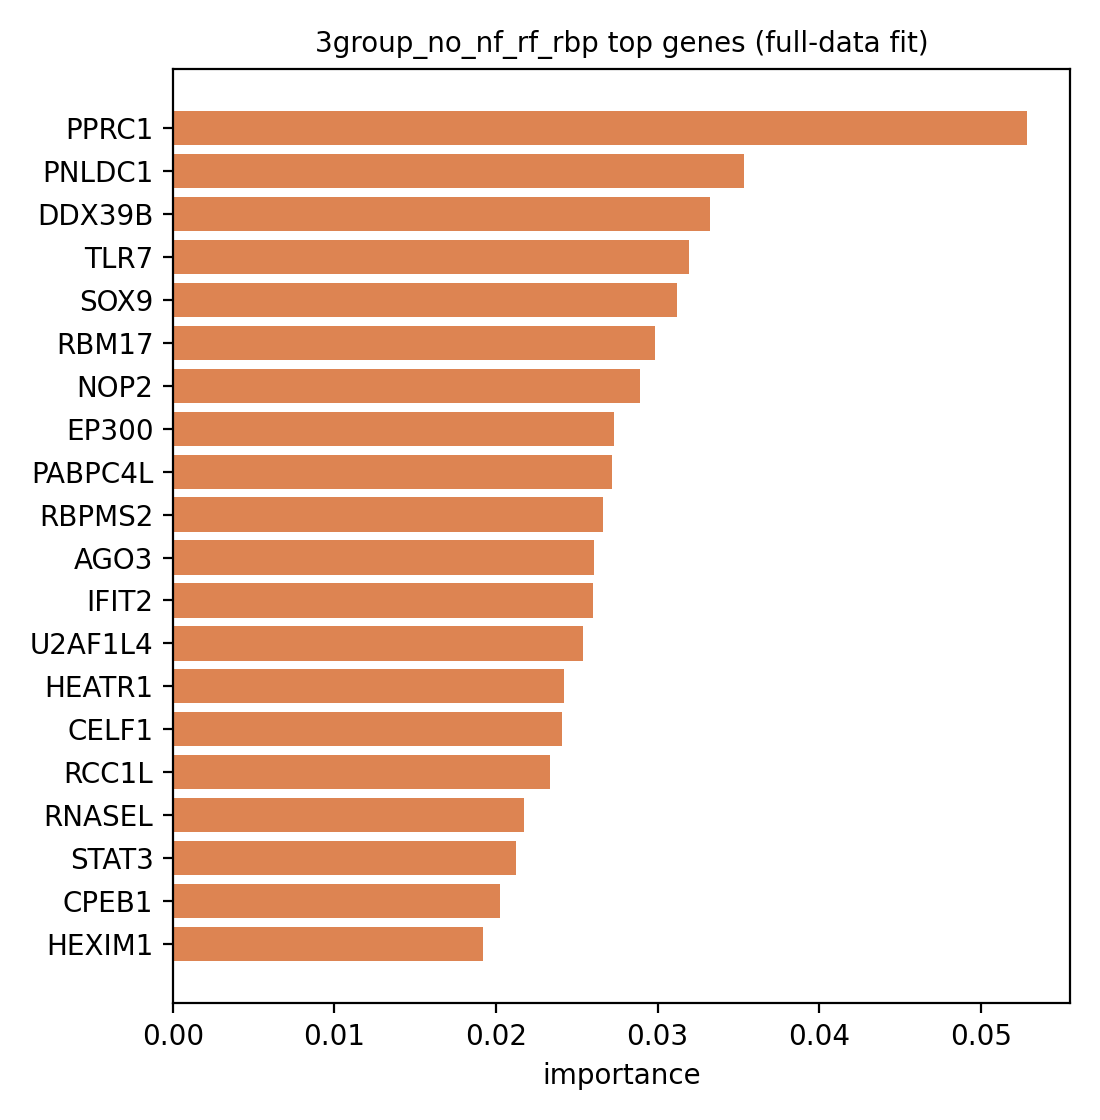
Top feature importance (full-data fit)
class
precision
recall_sensitivity
specificity
f1
support
auc
NF
1.000
0.857
1.000
0.923
7
0.994
PPCM
0.667
0.333
0.958
0.444
6
0.743
DCM
0.600
0.818
0.684
0.692
11
0.828
HCM
0.667
0.667
0.917
0.667
6
0.924
XGBoost — RBP-only set
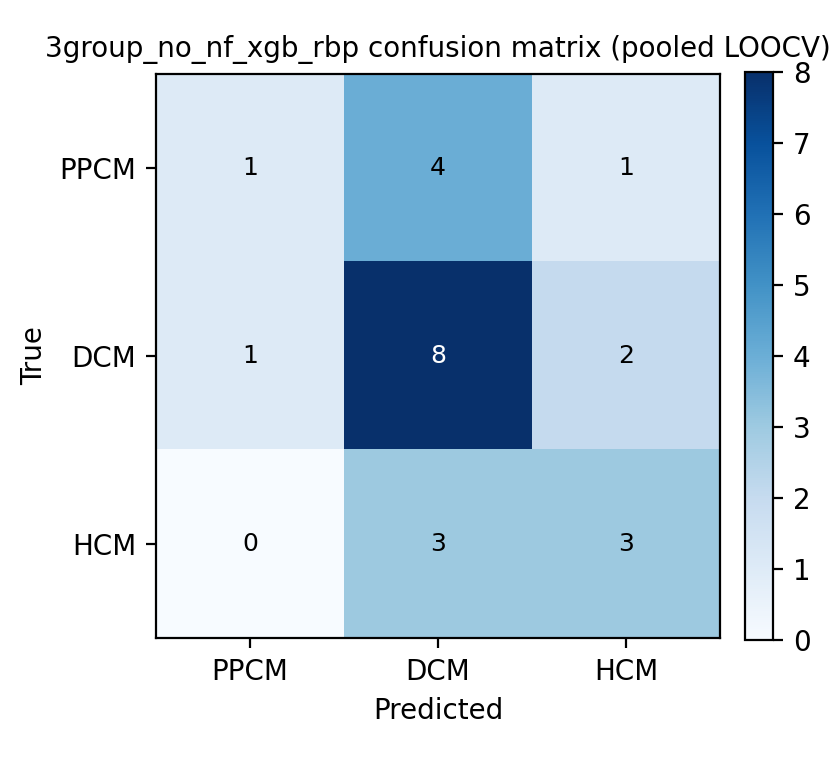
Confusion matrix (pooled LOOCV)
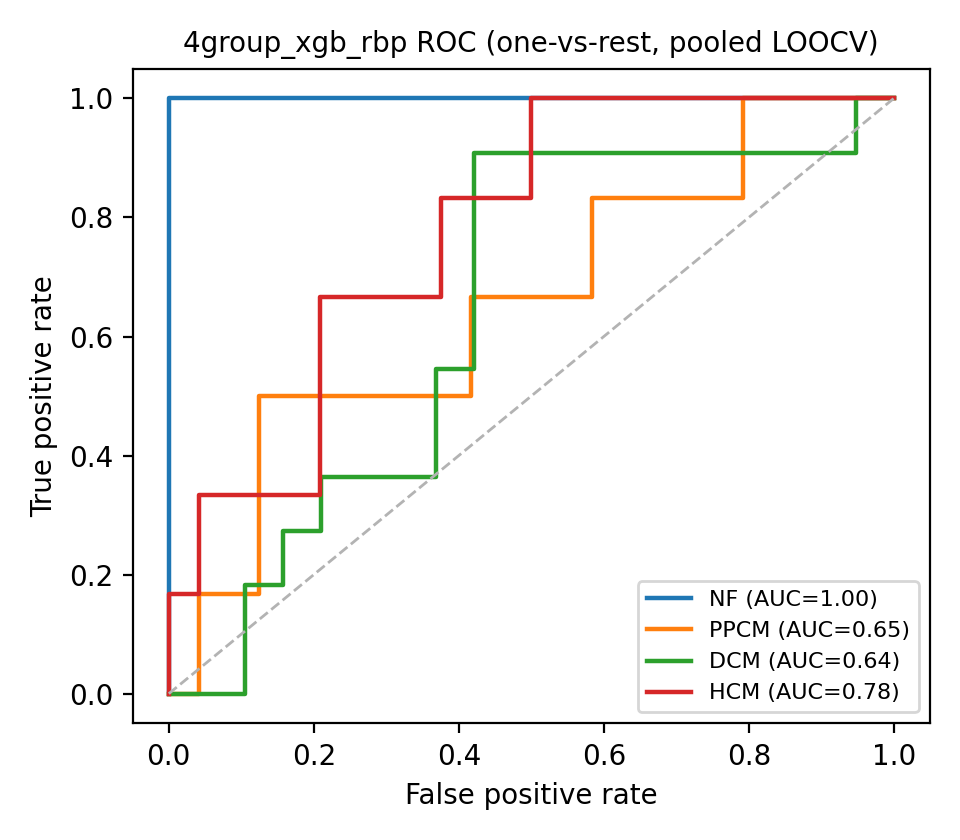
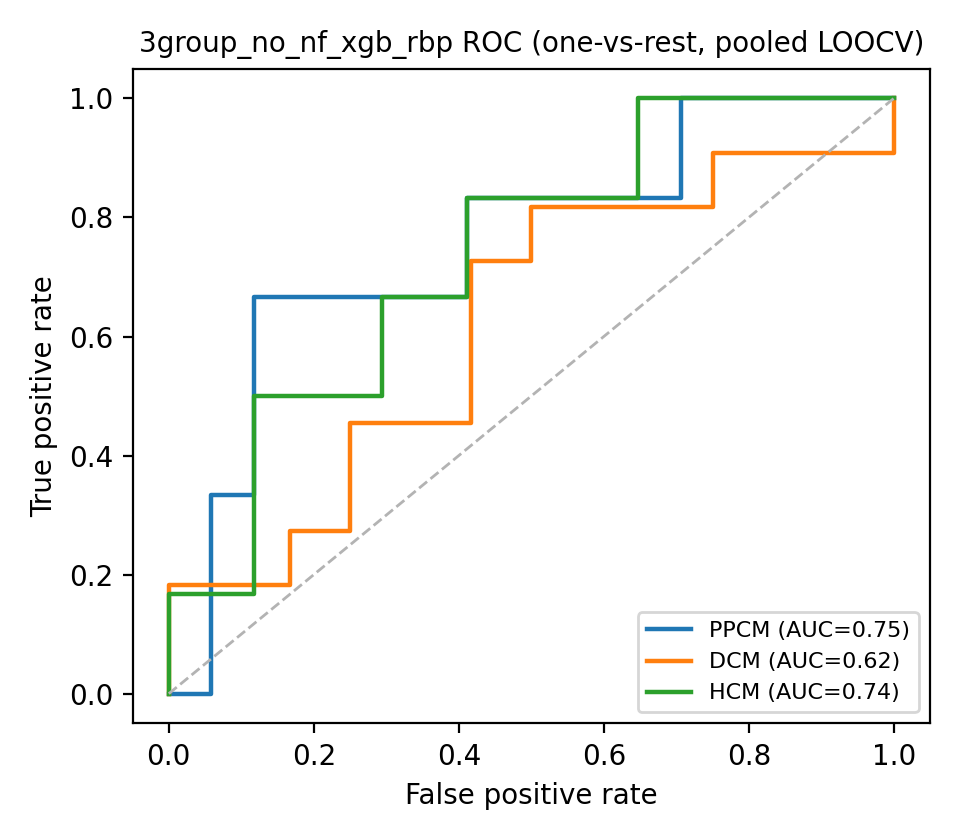
ROC (one-vs-rest, pooled LOOCV)
Top feature importance (full-data fit)
class
precision
recall_sensitivity
specificity
f1
support
auc
NF
0.875
1.000
0.957
0.933
7
1.000
PPCM
0.500
0.167
0.958
0.250
6
0.653
DCM
0.385
0.455
0.579
0.417
11
0.641
HCM
0.286
0.333
0.792
0.308
6
0.778
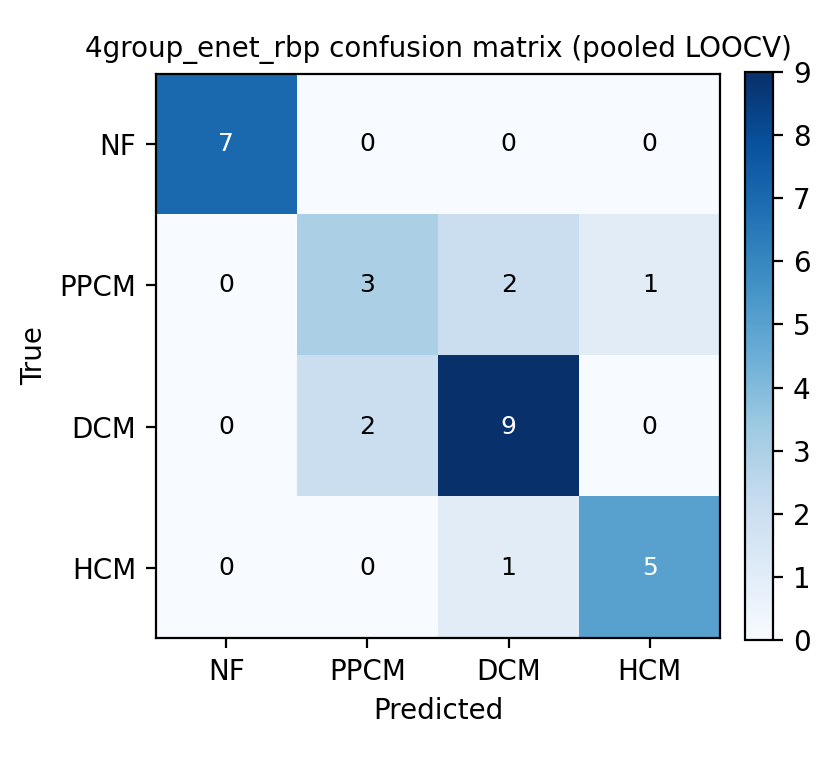
Elastic-net logistic regression — RBP-only set
Confusion matrix (pooled LOOCV)
ROC (one-vs-rest, pooled LOOCV)
Top feature importance (full-data fit)
class
precision
recall_sensitivity
specificity
f1
support
auc
NF
1.000
1.000
1.000
1.000
7
1.000
PPCM
0.600
0.500
0.917
0.545
6
0.833
DCM
0.750
0.818
0.842
0.783
11
0.880
HCM
0.833
0.833
0.958
0.833
6
0.972
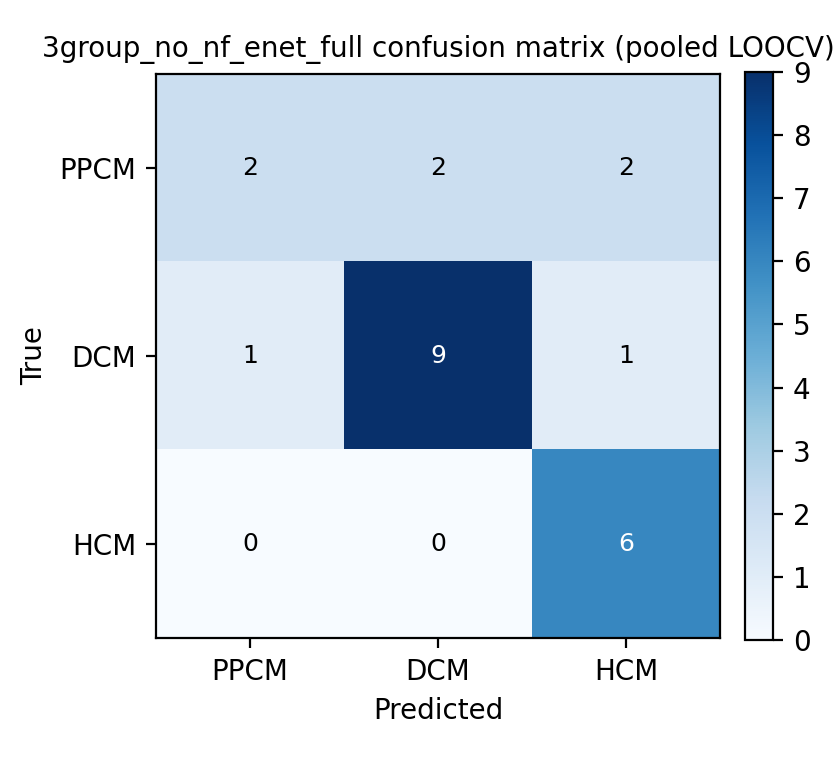
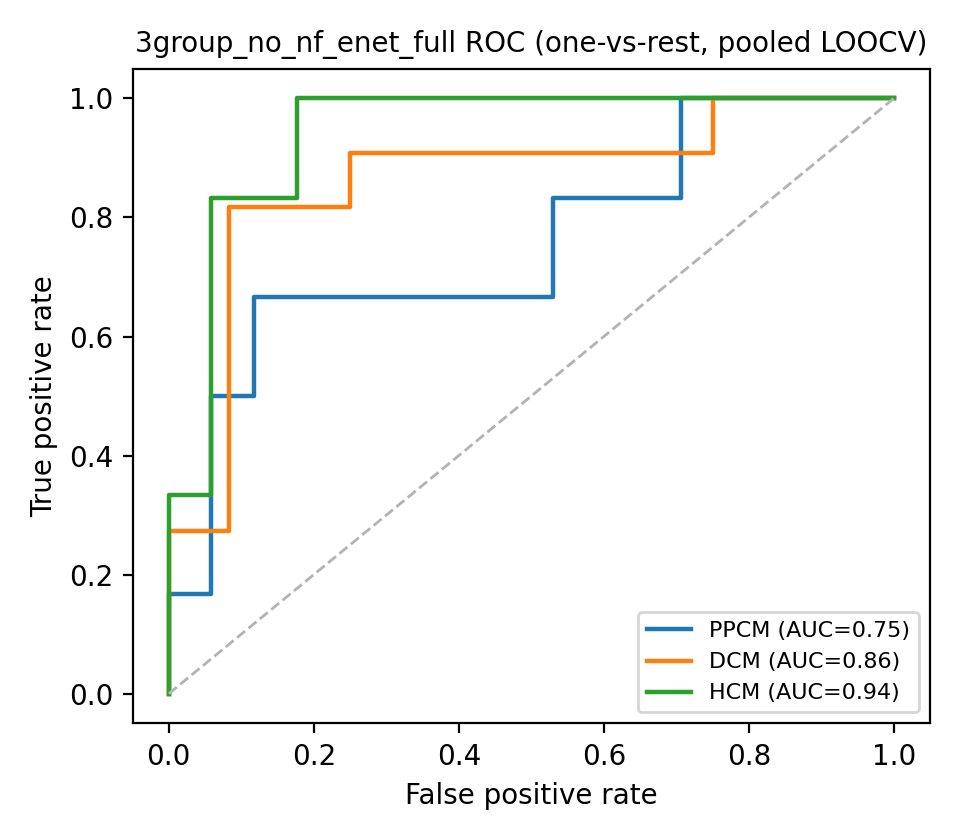
3-group, NF excluded: PPCM / DCM / HCM
Model comparison summary
Pooled Leave-One-Out CV. One row per model x feature-set combination.
model
feature_set
n_features
n_samples
accuracy
f1_macro
macro_auc
mean_specificity
RandomForest
Full-gene set (union of pairwise-DEG voting)
2844
23
0.565
0.421
0.781
0.755
XGBoost
Full-gene set (union of pairwise-DEG voting)
2844
23
0.522
0.454
0.692
0.735
Elastic-net logistic regression
Full-gene set (union of pairwise-DEG voting)
2844
23
0.739
0.688
0.853
0.866
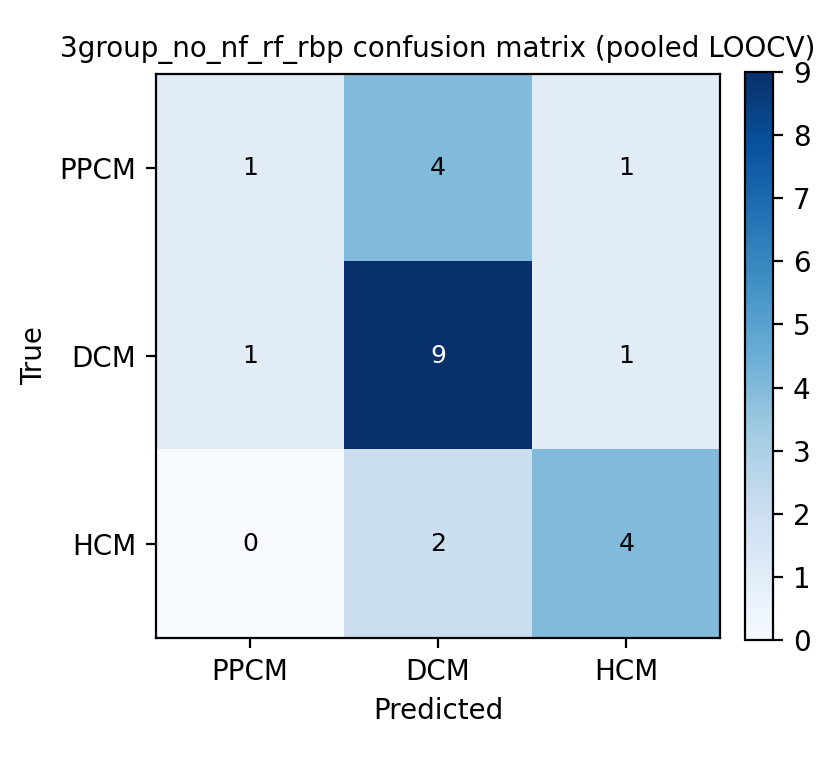
RandomForest
RBP-only set
72
23
0.609
0.536
0.670
0.775
XGBoost
RBP-only set
72
23
0.522
0.455
0.704
0.727
Elastic-net logistic regression
RBP-only set
72
23
0.696
0.681
0.849
0.838
Where do RBP genes rank in the full-gene model?
Percentile = 100 means most important gene of 2844 in the full-gene set; top 10 RBP genes by importance shown.
RandomForest — RBP genes within full-gene importance ranking (n=41, median percentile=44.5)
gene_symbol
importance
rank
percentile
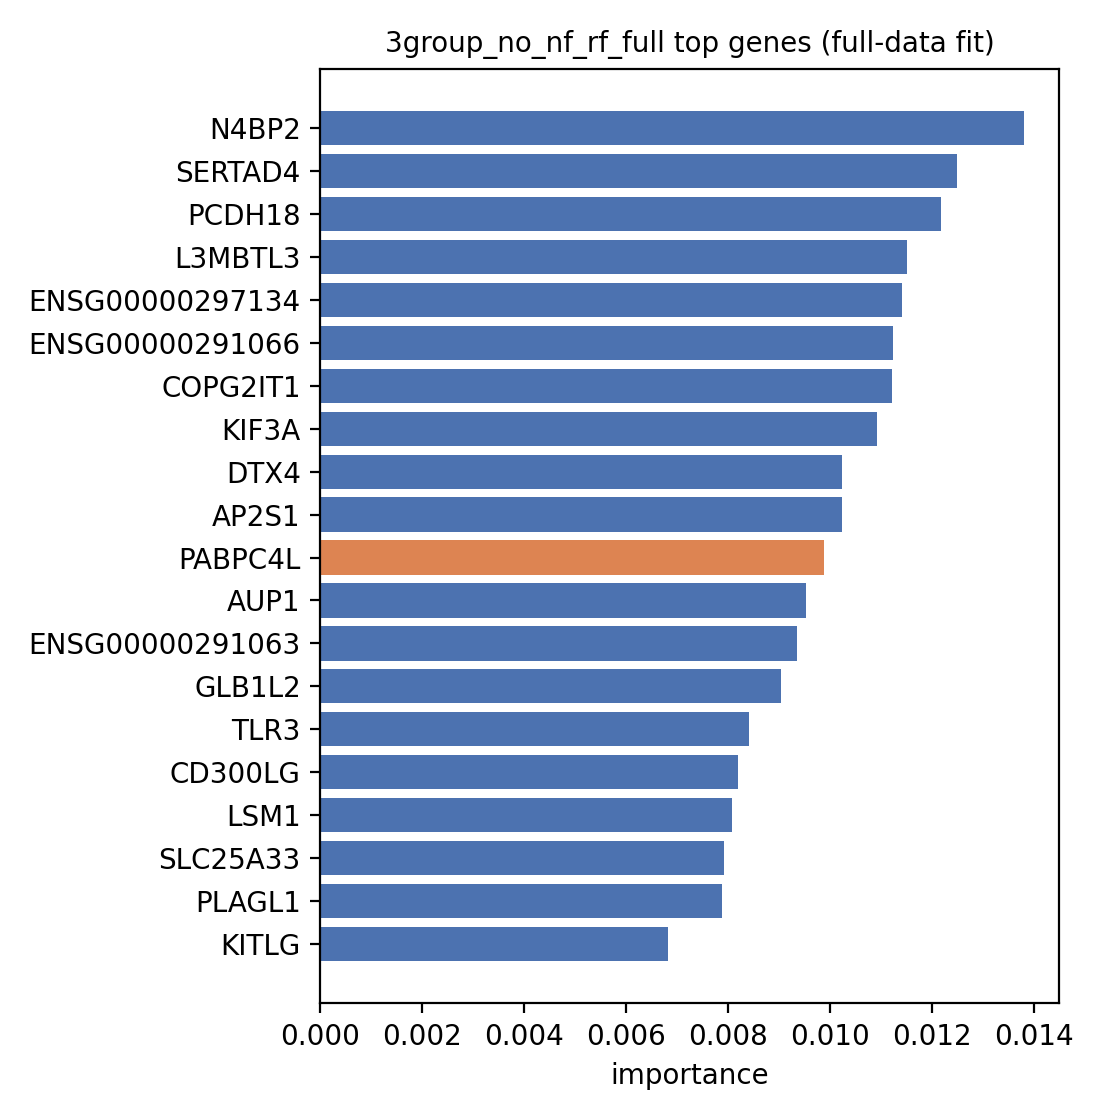
PABPC4L
0.010
11
99.613
NOP2
0.006
26
99.086
RBM17
0.005
69
97.574
U2AF1L4
0.003
168
94.093
OASL
0.002
181
93.636
HNRNPF
0.002
182
93.601
AGO3
0.001
224
92.124
STAT3
0.000
383
86.533
SNRPB
0.000
403
85.830
DDX60
0.000
545
80.837
XGBoost — RBP genes within full-gene importance ranking (n=41, median percentile=43.2)
gene_symbol
importance
rank
percentile
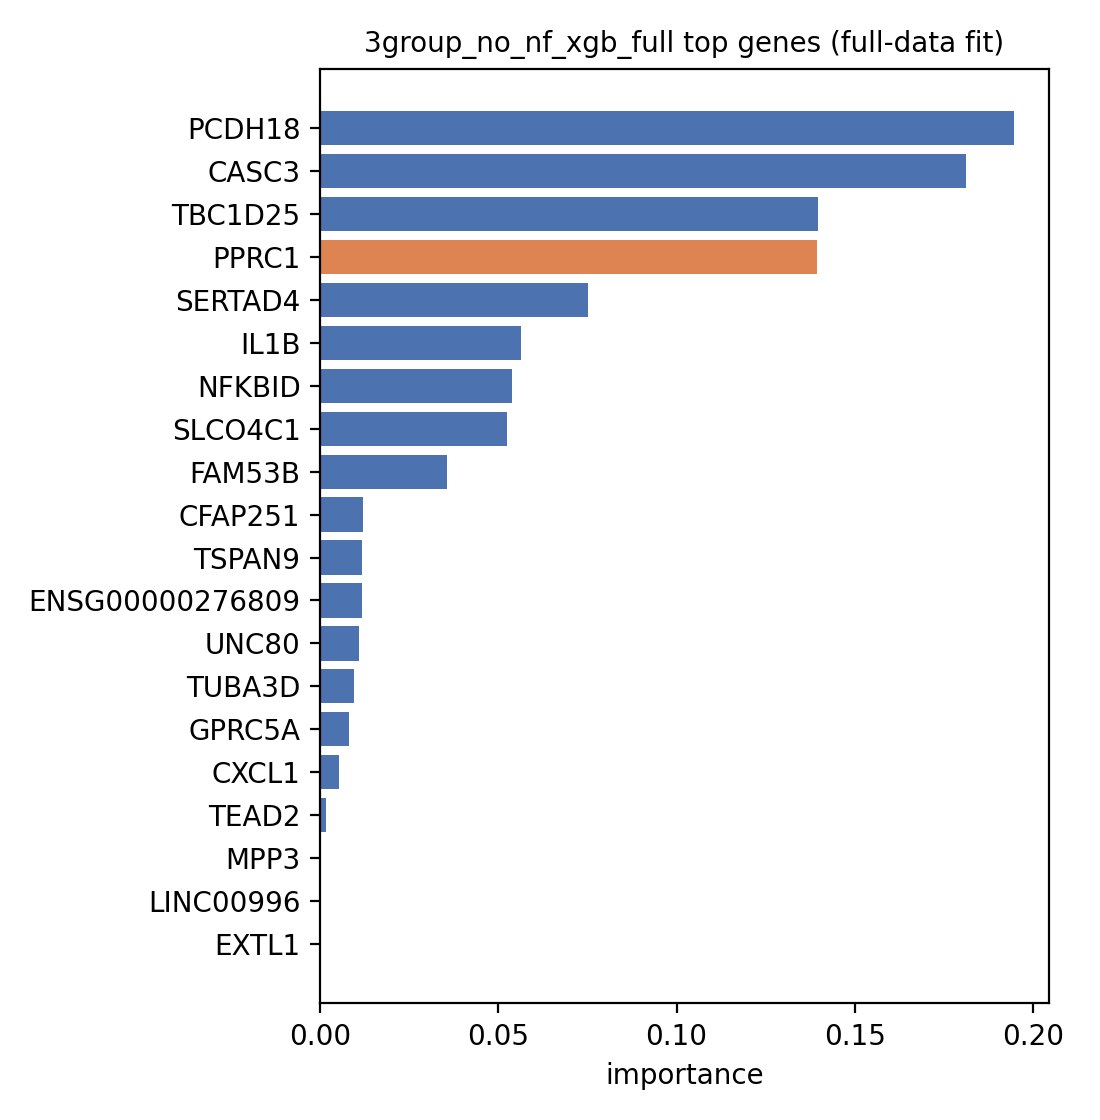
PPRC1
0.139
4
99.859
HNRNPF
0.000
196
93.108
STAT3
0.000
220
92.264
SHFL
0.000
382
86.568
SNRPB
0.000
500
82.419
DHX38
0.000
624
78.059
NUDT7
0.000
626
77.989
RNASEL
0.000
649
77.180
OASL
0.000
672
76.371
DDX60
0.000
688
75.809
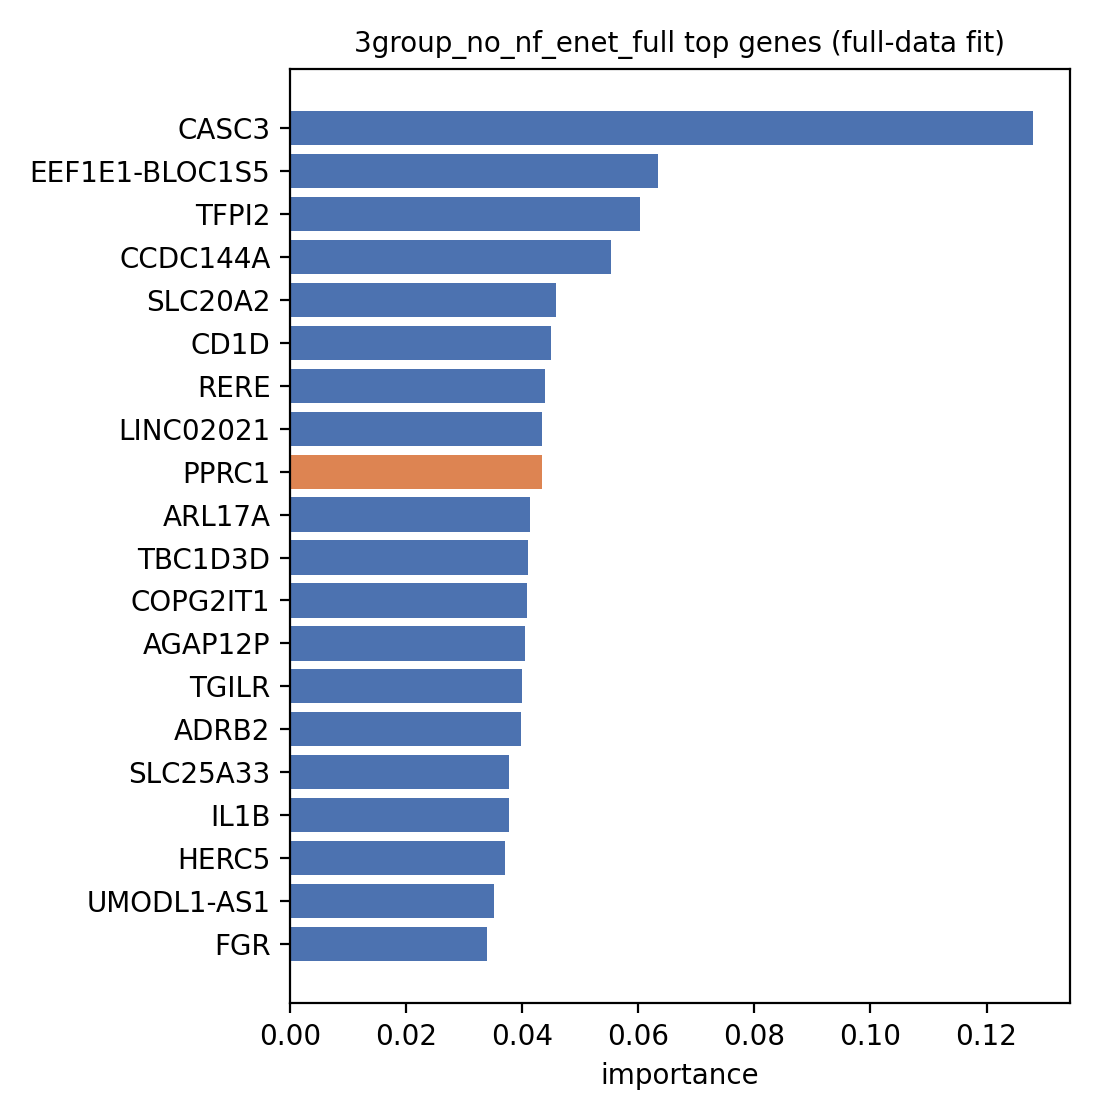
Elastic-net logistic regression — RBP genes within full-gene importance ranking (n=41, median percentile=45.3)
gene_symbol
importance
rank
percentile
PPRC1
0.043
9
99.684
RBM17
0.029
30
98.945
DDX39B
0.015
67
97.644
SOCS3
0.005
114
95.992
XPO5
0.002
136
95.218
HNRNPF
0.000
274
90.366
STAT3
0.000
296
89.592
RNASEL
0.000
494
82.630
OASL
0.000
517
81.821
SNRPB
0.000
526
81.505
Per-model detail
Confusion matrix, ROC curves and top feature importance for each model x feature-set combination.
RandomForest — Full-gene set (union of pairwise-DEG voting)
Confusion matrix (pooled LOOCV)
ROC (one-vs-rest, pooled LOOCV)
Top feature importance (full-data fit)
class
precision
recall_sensitivity
specificity
f1
support
auc
PPCM
0.000
0.000
1.000
0.000
6
0.642
DCM
0.600
0.818
0.500
0.692
11
0.788
HCM
0.500
0.667
0.765
0.571
6
0.912
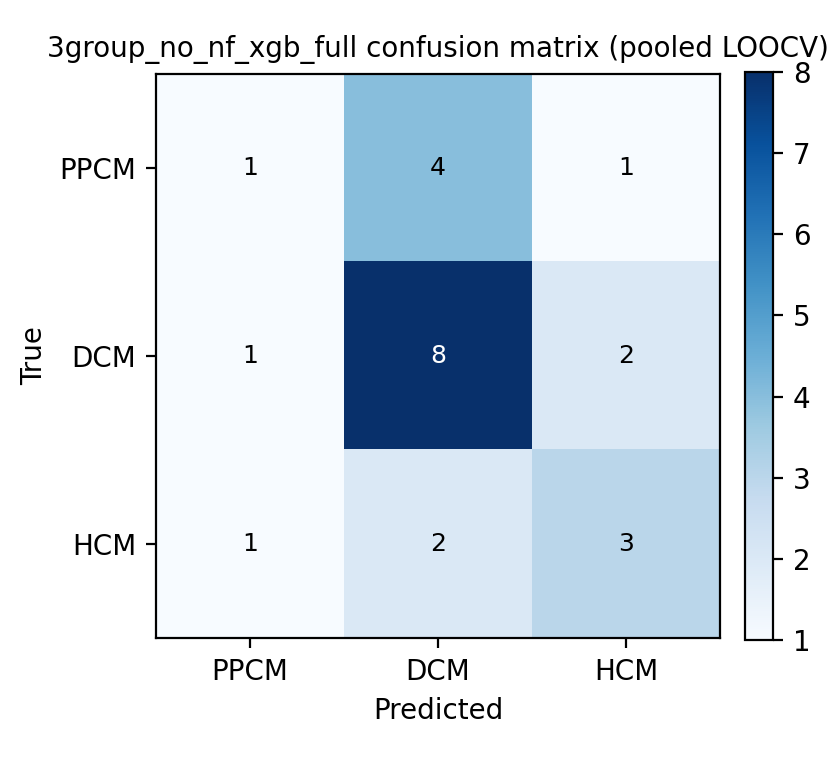
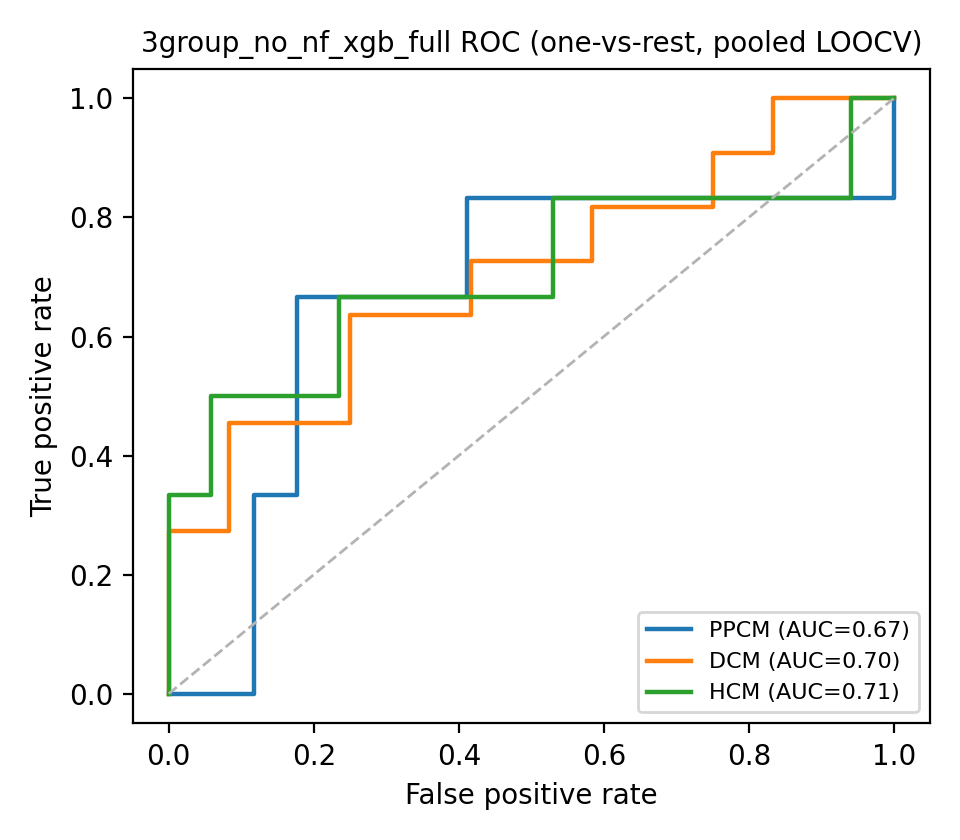
XGBoost — Full-gene set (union of pairwise-DEG voting)
Confusion matrix (pooled LOOCV)
ROC (one-vs-rest, pooled LOOCV)
Top feature importance (full-data fit)
class
precision
recall_sensitivity
specificity
f1
support
auc
PPCM
0.333
0.167
0.882
0.222
6
0.667
DCM
0.571
0.727
0.500
0.640
11
0.705
HCM
0.500
0.500
0.824
0.500
6
0.706
Elastic-net logistic regression — Full-gene set (union of pairwise-DEG voting)